
Monitoring street lighting warranties in QGIS provides an efficient way to manage public infrastructure. This tutorial showcases a practical example that tracks bulb type, installation date, and warranty expiration using rule-based symbology and Python scripting.
For one of the recent clients, a detailed point-based shapefile was created in QGIS to monitor the status of street light bulbs, including their installation date, warranty expiry, and bulb type.
📍 Dataset Structure
The attribute table contains the following fields:
- ID – Unique identifier
- Name – Unique name of bulb
- Type – Bulb type (LED or Halogen)
- Date_Post – Date of installation
- Waranty– Warranty expiry date
This allows a clear overview of lighting assets and their lifecycle status.
🎨 Custom Symbology for Warranty Status
Using a combination of bulb type and warranty status, we created a visual symbology rule-based style in QGIS to highlight:
- Bulbs under warranty
- Bulbs with warranty expiring in the next 30 days
- Bulbs with expired warranty
For example, this expression filters LED bulbs whose warranty expires in the next 30 days:
(to_date(“Waranty”) > to_date(now()) AND to_date(“Waranty”) < to_date(now() + to_interval(’30 days’))) AND “Type” = ‘LED’
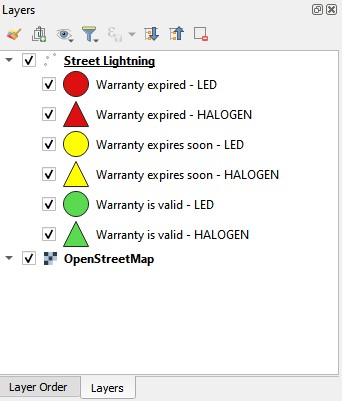
Map view showing different bulb symbols by type and warranty status.
⚠️ Automatic Pop-Up Alert on Project Load
To help the client stay proactive, we implemented a Python script that runs upon project load and displays a pop-up alert if any bulbs have warranties expiring in the next 30 days.
Here’s a simplified overview of how it works:
- Script scans the layer named “Street Lightning”
- Parses the Garancija date field
- Checks if the date falls within the next 30 days
- Displays a QMessageBox warning with the count of such bulbs
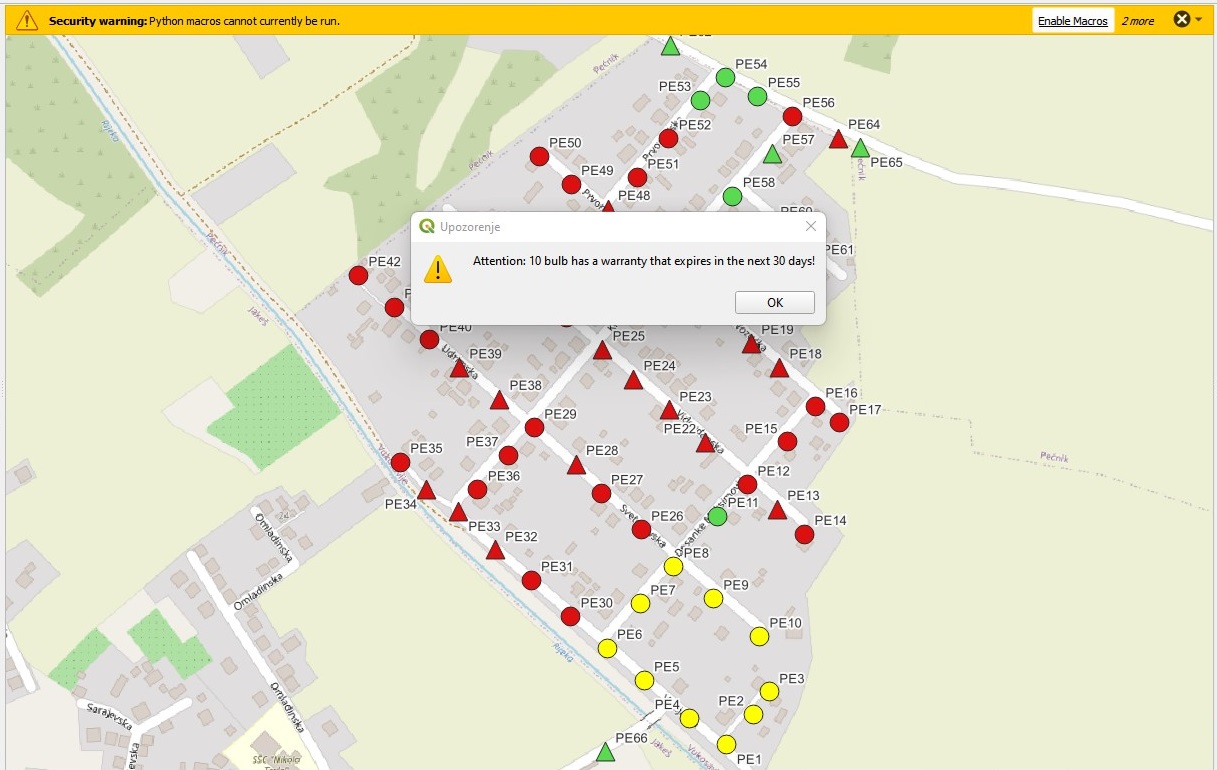
💡 Outcome
The result is a user-friendly, map-based dashboard that helps city administrators:
- Quickly identify assets needing attention
- Avoid unexpected maintenance costs
- Streamline field inspections
With this QGIS setup, users can take immediate action based on visual and automated alerts – right when opening the project.
🚀 Next Steps
This example is designed for desktop GIS solutions using QGIS. However, this and similar solutions can also be published and visualized on a web map platform.
Municipalities or companies that manage public lighting and other spatial infrastructure can benefit from implementing a similar geospatial monitoring solution tailored to their operational needs.