
📝 Introduction
Street lightning warranty monitoring is essential for improving maintenance planning and reducing operational costs. In my previous post Monitoring Street Lighting Warranties in QGIS, I showed how to track street light warranty statuses in QGIS using spatial layers and color-coded symbols. While this approach is great for visual inspection, it required manual operations and was limited to local work in QGIS.
Now, I have upgraded the system by moving to a PostgreSQL database and creating an interactive dashboard, making warranty monitoring easier, more transparent, and accessible in real-time to all relevant users.
🗄️ Migrating Data to PostgreSQL
CREATE TABLE street_lights (
id SERIAL PRIMARY KEY,
geom GEOMETRY(Point, 3908),
name VARCHAR(20),
type VARCHAR(20),
date_post DATE,
warranty VARCHAR(50),
updated_by TEXT,
updated_at TIMESTAMP DEFAULT CURRENT_TIMESTAMP
);
To automate warranty status updates without additional manual actions, I created a VIEW in the database. This view includes a new column warranty_status that automatically updates the status based on installation date and current date (Active Warranty, Expires in 30 Days, Expired). The view is then used directly to display data on the map.
CREATE OR REPLACE VIEW warranty_view AS
SELECT
	id,
	name,
	type,
	date_post,
	warranty,
	updated_by,
	updated_at,
	CASE
		WHEN warranty > CURRENT_DATE + INTERVAL '30 days' THEN 'Active Warranty'
		WHEN warranty BETWEEN CURRENT_DATE AND CURRENT_DATE + INTERVAL '30 days' THEN 'Expires in 30 Days'
		WHEN warranty < CURRENT_DATE THEN 'Expired'
	END AS warranty_status,
	geom
FROM street_lights;
The table contains key information:
- ID – Unique identifier
- Location – geometry
- Name – Unique name of bulb
- Type – Bulb type (LED or Halogen)
- Date_Post – Date of installation
- Warranty – Warranty expiry date
This allows a clear overview of lighting assets and their lifecycle status.
Data from QGIS layer was imported using DB Manager or SQL INSERT commands.
📊 Dashboard - Warranty Overview
The main advantage of moving to a database is the ability to create an interactive dashboard. The dashboard allows:
- Real-time overview of street lights by warranty status
- Visualization of street light locations on a map
- Quick identification of lights with expiring warranties
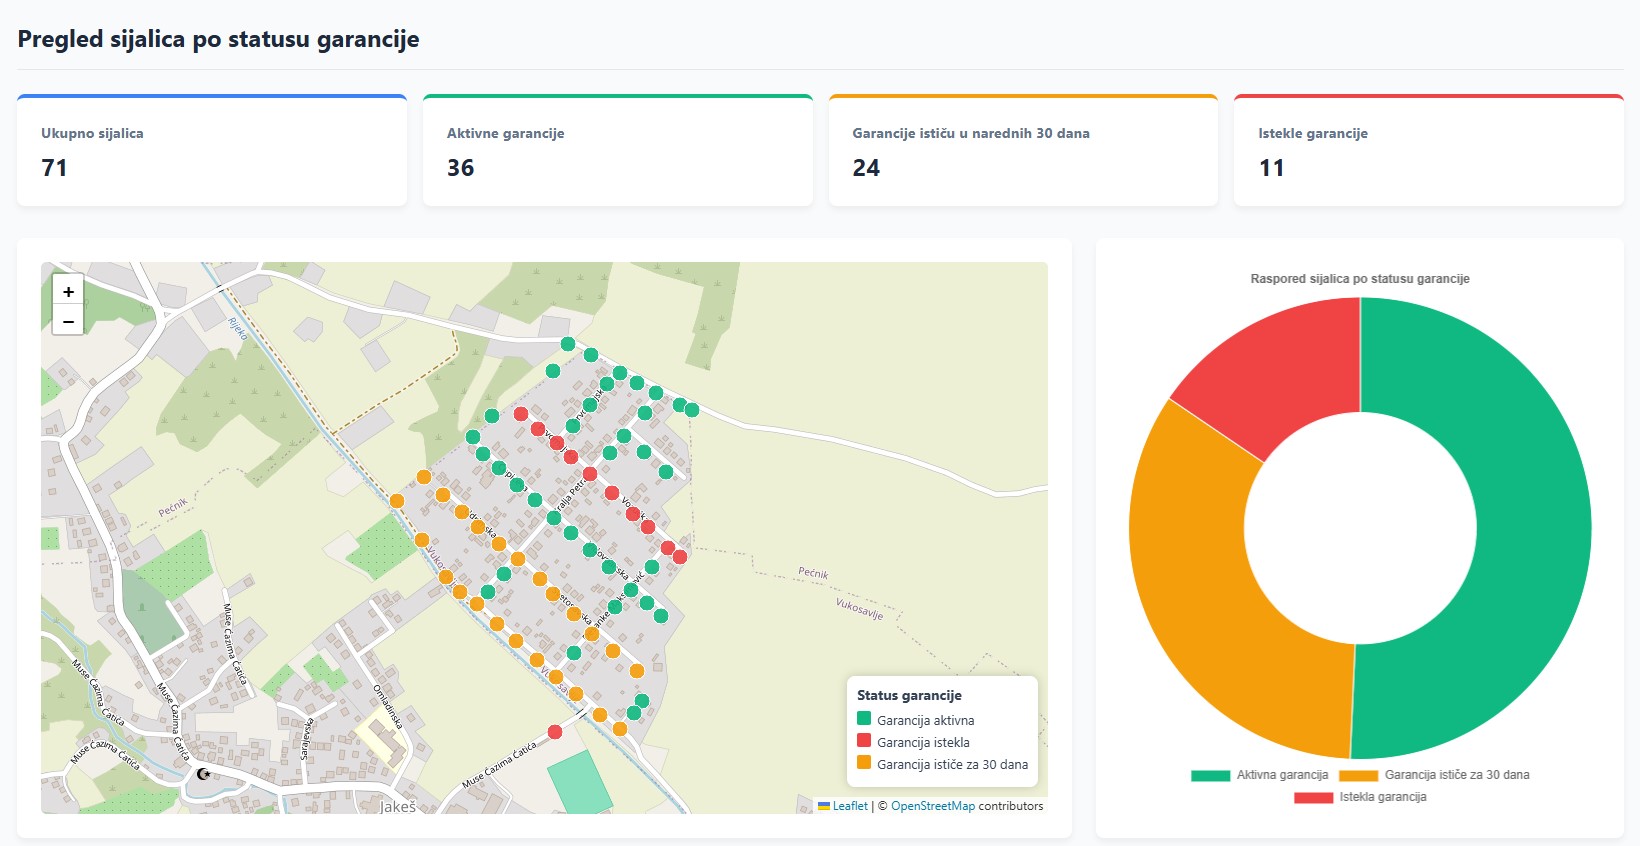
Dashboard Screenshot Example
The dashboard is built using Leaflet.js for the map and charts.js for charts. Data is dynamically fetched from the PostgreSQL, using Python.
✨ Benefits of the Upgrade
This upgrade brings several key benefits:
- Faster data filtering and search – no need to manually inspect QGIS layers
- Centralized database – all users access the same data
- Interactive visualization – maps and charts update automatically
- Advanced analytics possibilities – statistics by light type, installation date, warranty status, etc.
✅ Conclusion
By moving from a static QGIS layer to a PostgreSQL database and interactive dashboard, monitoring street light warranties has become more efficient and transparent. This upgrade opens possibilities for:
- Automated notifications for expiring warranties
- Advances statistics and analytics
- Integration with other GIS systems
In upcoming posts, I plan to show how to add automated notifications and energy consumption analysis by location.